BLOGS WEBSITE
Teamwork Analysis Dashboard
CSER has developed a teamwork dashboard, founded on learning analytics, learning theory and teamwork models that analyses students’ online teamwork discussion data and visualises the team mood, role distribution and emotional climate. This tool allows educators to easily monitor student teams in real-time. Educators may use the tool to provide students with feedback about team interactions as well as to identify teams that are experiencing problems, and may require interventions.
The idea of the dashboard is to produce an easy to use, and scalable, visualisation system to aid lecturers in managing courses with teamwork. The dashboard is designed to assist teaching by analysing online team discussions to identify what kinds of roles individuals are taking on in the discussion, i.e. leadership, support, coordination, etc, and also the sentiment expressed in the discussion, i.e. frustration, anger, joy, concern. This automated analysis, based on NLP and text analysis techniques, will assist teachers by helping them quickly identify teams where progress is not being made, where required roles are not being undertaken by the team members, or where discussion has reached a point where it needs assistance from the teaching staff.
Background
As the complexity of software projects has grown over the years, and teamwork has become an integral part of software industry, the ability for Computer Science graduates to participate effectively in professional teamwork has become crucial. To better prepare their students for industry, academics frequently integrated team projects and collaborative assignments into the Computer Science curriculum. However, there are still concerns expressed by industry and within Universities as to whether our students are actually learning how to work in teams. We don’t really help this, within the University sector, as we often assess team or collaborative projects based on the output of the project rather than on the success of the collaboration. We very rarely tend to assess individual students based on how well they worked as team!
CSER has been exploring different mechanisms for assessing and analysing teamwork over the past few years. We have explored the use of Contributing Student Pedagogy, and peer assessment within our first year courses as a way of integrating collaboration with more explicit understanding of why collaboration is there. (You can read more about this here and here).
Previously, we had developed an online collaboration assessment framework based on Dickinson and McIntryre’s teamwork model. We selected the teamwork roles defined by Dickinson and McIntyre because the teamwork model focuses on practical roles of self-organising teams. Dickinson and McIntyre classified seven core components of teamwork: Team Leadership, Team Orientation, Monitoring, Coordination, Communication, Feedback and Backup Behaviour and provided with their model a guide to measure performance. Our manual classification framework has proved to be a good basis for the development of an automated analysis framework that incorporates team role classification of online team discussions, as well as classification of the emotional climate, using sentiment analysis, of the team discussion.
Teamwork Analysis Dashboard
The Teamwork Dashboard presents a visualisation of collaboration showing detected roles for each participant, and discussion sentiment for the group as a whole. The dashboard analyses a text-based transcript of the collaboration, and has been constructed to operate over on-line collaboration transcripts from systems such as Piazza. The figure below illustrates a snapshot of the Teamwork Dashboard illustrating one team’s team-role classification in focus, along with sentiment analysis graphs. The dashboard features a summary of all teams at the bottom of the screen, where the educator may select between a summary of all teams and their sentiment analysis or the team role adoption.
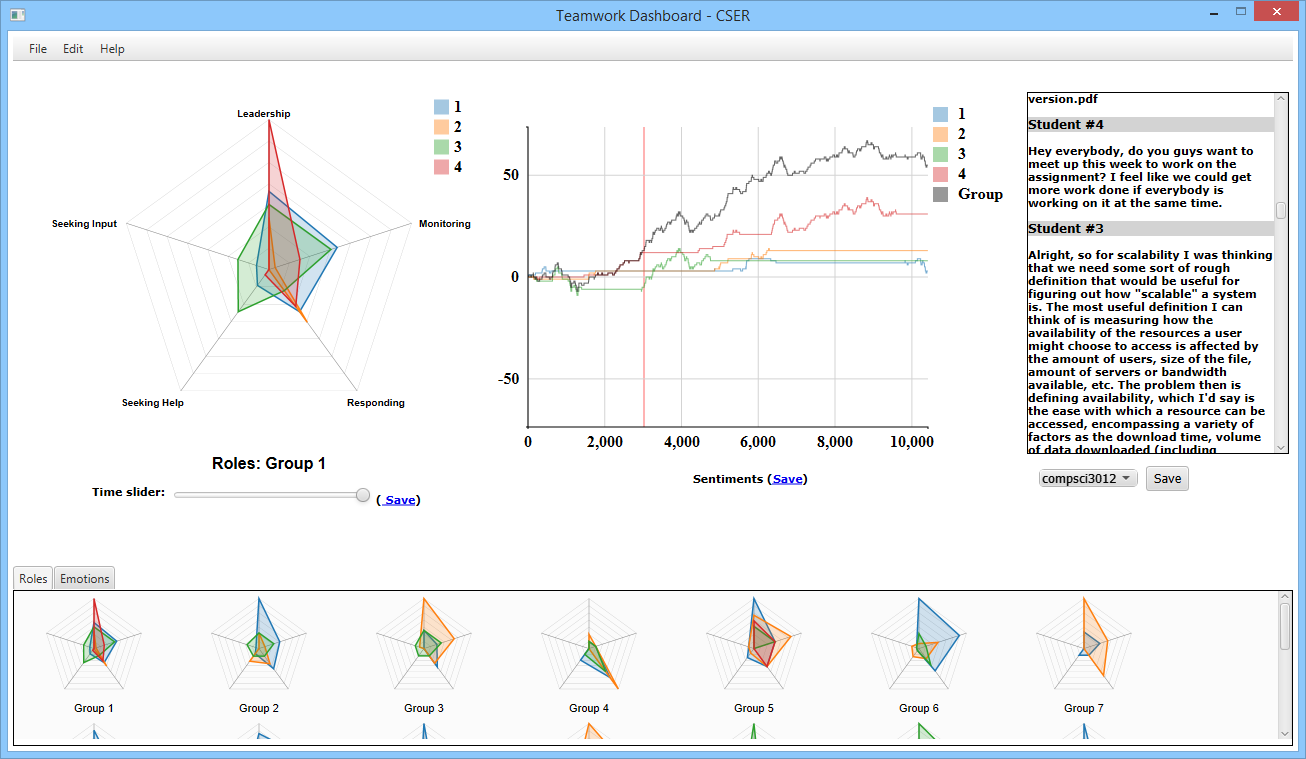
The entire Teamwork Analysis Dashboard, showing teamwork role classification and sentiment analysis
Using our teamwork role framework (adapted from Dickinson and McIntyre’s framework), we automatically extracted evidence of particular roles in the teamwork discussions using expressions. The following team roles are identified in the Teamwork Dashboard:
- Leadership: This role includes behaviours where a team member provides direction for the team in the teamwork activity. Leadership can focus on direction and instruction for (individual) team member activities, the collaborative task at hand or about general team processes.
- Monitoring: This role involves team members monitoring their own, a peer’s or the whole team’s performance and/or progress.
- Seeking Input: This “seeking” (input) behaviour includes behaviours associated with seeking feedback on contributions to the teamwork activity.
- Seeking Help: This “seeking” (support) behaviour, includes behaviours associated with “seeking” support, help or advice from the team or explicitly from individual team members.
- Responding: The “responding” role complements other roles. In this role, students respond to team members questions, and comments and share thoughts and views. This role is essentially about demonstrating an element of support to the team and being an active group member.
The roles can change to fit the domain and there are opportunities to change, extend or adapt the roles to suit context needs. The figure below illustrates the team role identification for a single team. What is shown are the individual classifications according to the different roles for each individual within the team (each illustrated as a different colour).
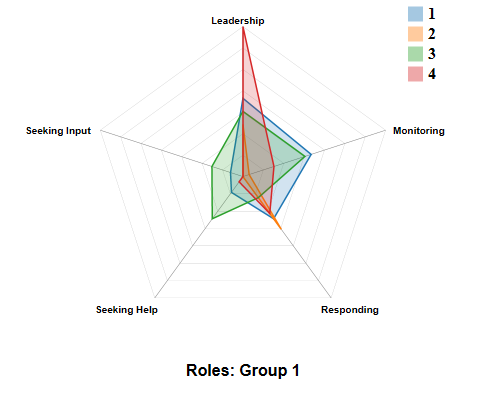
Team roles component of the Teamwork Dashboard: visualising the frequency of identified contributions per role, per student
The Teamwork Dashboard provides analysis and monitoring with a focus on teamwork roles adapted by learners in the discussion. The dashboard provides a visualisation of learners’ roles through spider graphs showing behaviour frequencies (the longer the line, the greater the frequency) generated from executing search queries on the discussion data. The slider may be used to move backwards and forwards in time to observe the evolution of roles as the team progresses through their task. The discussion associated with the emotion or team role displayed, is shown to the right on the dashboard, so that the lecturer can review the discussion itself.
The evolution of emotions is also extracted and visualised. The figure below illustrates the visualisation of emotions established via sentiment analysis techniques, demonstrating the overall group sentiment over time, along with the sentiment associated with the discussions attributed to each individual. The sentiment represents the mood of the team by measuring the polarity of negative and/or positive sentiment in discussions. In the teamwork graph, whenever a negative or positive sentiment is encountered, the line graph shifts up or down, correspondingly.
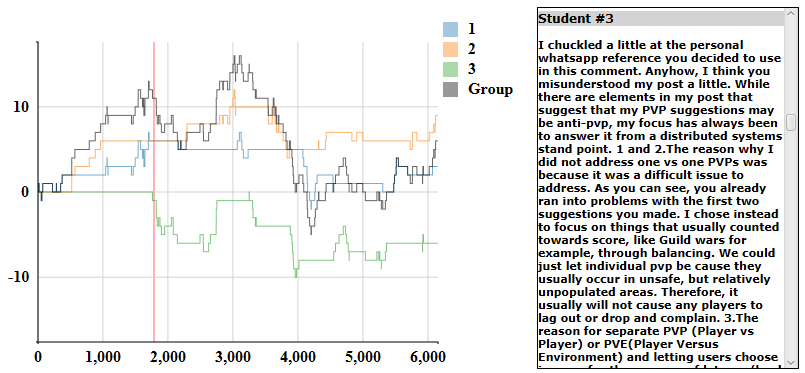
Sentiment component of the Teamwork Dashboard: the polarity of students’ sentiment expressed in teamwork contributions by word count
This is also be expressed as a spider graph within the tool. Using a spider graph, the various emotions expressed by team members are visualised.
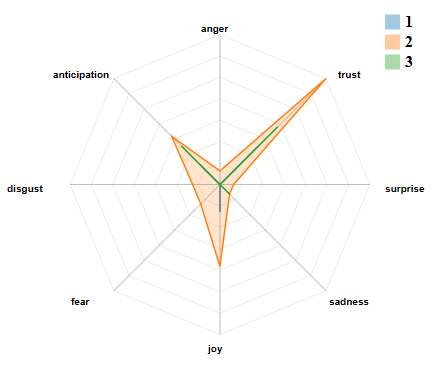
Team emotions component of the Teamwork Dashboard: visualising students’ frequencies of emotions expressed in contributions
The tool is designed to take input as CSV file from Piazza or a Learning Management System discussion forum, but converters can be developed easily to integrate text-based online discussions from other sources.
In the video below, we provide a demonstration of the Dashboard and how you can import data, preview, save, configure and interact with it (view via YouTube).
We are very keen on testing the use of our Teamwork Analysis Dashboard with others – if you are interested in trying it out, please contact us and we can provide you with a copy of the Dashboard for your use!
References
Dickinson, T., & McIntyre, R. (2009). A conceptual framework for teamwork measurement. In M. Bannick, E. Salas & C. Prince (Eds.), Team Performance Assessment and Measurement: Theory, Methods, and Applications. Mawah, New Jersey: Lawrence Erlbaum Associates, Inc.
Munezero, M., Montero, C., Mozgovoy, M, & Sutinen, E. (2013). Exploiting sentiment analysis to track emotions in students’ learning diaries. In Proceedings of Koli Calling, Koli, Finland.
Tarmazdi, H., Vivian, R., Szabo, C., Falkner, K., & Falkner, N. (2015). Using learning analytics to visualise Computer Science teamwork. 20th Annual Conference on Innovation and Technology in Computer Science Education (ITiCSE 2015), Lithuania.
Vivian, R., Falkner, K., & Falkner, N. (2013). Analysing computer science students’ teamwork role adoption in an online self-organised teamwork activity. In Proceedings of Koli Calling, Koli, Finland.
Vivian, R., Falkner, K., Falkner, N., & Tarmazdi, H. A method to analyse computer science students’ teamwork in online collaborative learning environments. Accepted for ACM Transactions in Computing Education, 2015.
Vivian, R., Falkner, K., & Falkner, N. (2013). Building consensus: students’ cognitive and metacognitive activities during wiki construction. In Proceedings of the First International Conference on Learning and Teaching in Computing and Engineering (LATICE 2013), Macau.
Vivian, R., Tarmazdi, H., Falkner, K., Falkner, N., & Szabo, C. (2015). The Development of A Dashboard Tool for Visualising Online Teamwork Discussions, 37th International Conference on Software Engineering, Education Track, Italy.