This is the fourth in a series on Where the Complex Points Are.
- Where the complex points are: introduction to the iplane concept
- Where the complex points are: on a line
- Where the complex points are: on a parabola
- Where the complex points are: the graph of a function (YOU ARE HERE)
- Where the complex points are: where the idea came from
This one wasn’t part of the original plan, but some interesting thoughts have come up while discussing the previous posts on Twitter, and I needed to process them. So here we are doing an extra blog post before my final epilogue.
A problem of viewpoints
In the introduction, I talked about how I’ve always wondered where the complex points are when you talk about a parabola meeting the x-axis in complex points. I introduced the concept of an iplane: at each point (a,b) in the real plane, there is an iplane attached, which contains all the points (a+ci,b+di). These points are arranged with the x-axis showing the imaginary part added to the x-coordinate and the y-axis showing the imaginary part added to the y-coordinate. I imagine them as being a transparent sheet attached to the point itself and being able to be flattened out to sit on top of the real plane.

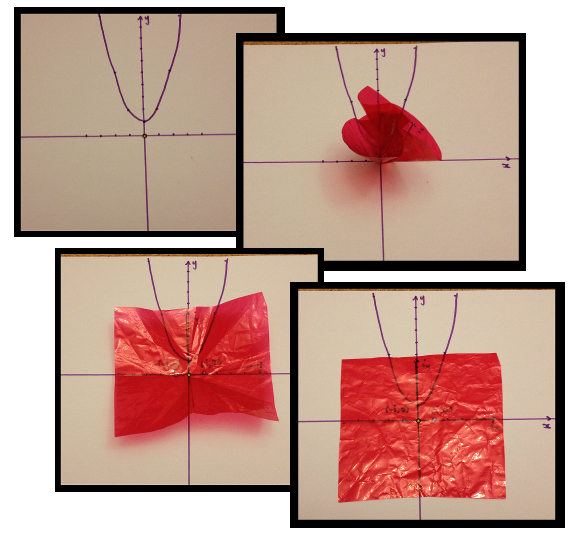
This representation of the complex points allowed me to investigate the complex points that lie on lines (both complex lines and real lines) and to investigate the complex points that lie on a vertical parabola, and also how lines meet such a parabola. I shared these thoughts on Twitter, and waxed lyrical about them in person to basically every person I met. People were impressed, but there was something in the way they spoke that niggled at me and I couldn’t figure out what it was.
Yesterday I figured out the problem: I was thinking about the lines an parabolas in totally different ways to other people! In my head, the lines and parabolas were sets of points whose coordinates satisfy a condition. To decide if a point is part of the set, you sub its coordinates into the equation and see if it’s true: if it’s true, then the point is on the object, if it’s not true then the point isn’t on the object. I was looking to see which points were on the parabola by simply subbing the coordinates in to see which ones worked. I did this one iplane at a time because it seemed the most reasonable way of organising my search.
But what was reasonable to me was not reasonable to others! Taking each iplane one at a time and looking to see which points in the iplane satisfy the equation was totally alien to quite a few people I talked to. These people totally understood the iplane concept and they thought it was a great idea, but they had no idea what I was getting at by looking in each iplane separately. Yesterday I realised why: they were thinking of the lines and parabolas as an organisation of the input/output relationship for a function. They were looking for an x-axis and a y-axis to “line up” the input and the output of the function formula.
This is of course a perfectly valid way to think of many graphs, especially for the parabolas I was looking at, whose equations all look like “y = something in terms of x”. It’s just that I wasn’t thinking about them that way so my iplanes weren’t designed to match with this viewpoint. So I started thinking about how to make it match.
The complex line
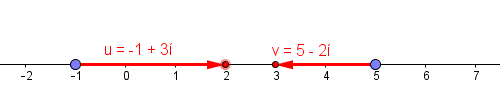
There is one key issue with making the graph relate more closely to the idea of lining up the input on the x-axis with the output on the y-axis: the input is a complex number and it doesn’t really live on the x-axis. But, I dealt with that problem already in the plane by adding an iplane to each point of the plane. Surely I could do the same thing to the line, right? Why can’t I add an iline to each point on the real line? The iline attached at the number a would contain all the numbers of the form a+bi.
With the iplanes, I flattened them out to sit on top of the real plane so I could see the complex points, but I only flattened out enough to see the point I was looking for. I wanted to do the same thing with the ilines, but it’s not really the same feel. Somehow I can’t tell so easily what’s going on with the complex number. Then I realised what I could do is just draw an arrow from the point representing the real part to the complex number in its iline. That is, I could draw the number a+bi as the point a on the number line and an arrow of length and direction b starting from that point. So the following representation was born:
You can investigate what complex-number addition looks like in this representation with this GeoGebra applet, and what complex-number multiplication looks like with this GeoGebra applet. (This representation is not so good for complex multiplication, but that’s ok — different representations are useful for different things.)
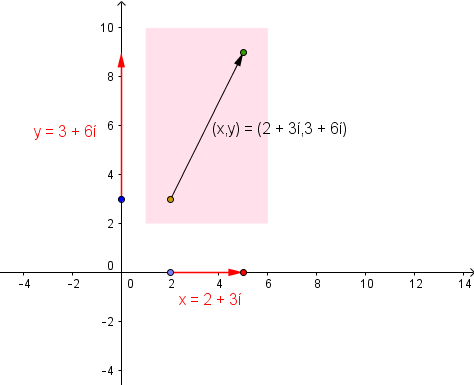
A complex x-axis and y-axis
So I was now able to locate a point on the x-axis as an input for a function, and locate its output on the y-axis. Then something rather wonderful happened: I realised that I could combine this point-and-arrow x-coordinate and this point-and-arrow y-coordinate into one point-and-arrow in the plane. The point (p+ri,q+si) became the point (p,q) and the arrow (r,s) starting at that point.
But the point (p,q) is the centre of the iplane in which the complex point (p+ri,q+si) lives! And the arrow (r,s) is the vector-version of the coordinates (r,s) within that iplane! So it turns out that my point-and-arrow x-coordinates and y-coordinates matched up perfectly with my iplanes! I couldn’t be happier!
The complex graph of a real function
So now I was able to investigate graphs of complex functions from the perspective of input-output relationships. It’s a whole different way of thinking about things, and I haven’t investigated it to any great depth yet, but so far it is most interesting. One particular thing I’ve noticed is that quadratic functions are rather special when it comes to how the real images of the complex points are arranged — the tangents seem to play a much bigger role than they do for higher polynomials.
I’ve made a GeoGebra applet that will allow you to enter a real function and move the input around on the x-axis to see what happens to the output and the matching complex point on the graph. You can turn on the trace to see what shape is made when you do move the input around. I now have a host of new questions rising in my mind which I hadn’t even considered before, and it will probably take years to sort them out.
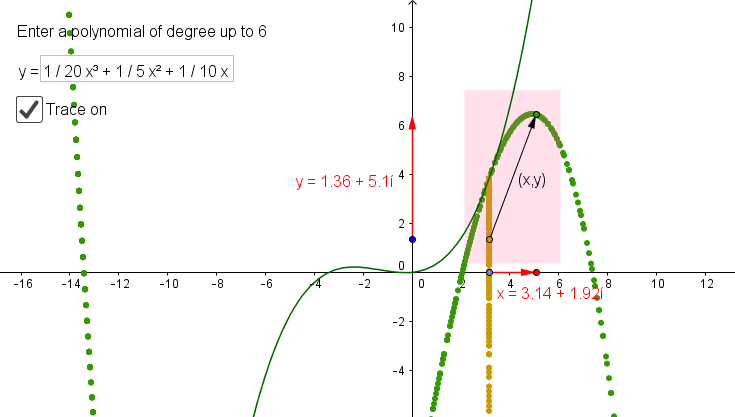
But for now I’ll just be content that I have a picture that works for both views of a graph: as a collection of points that satisfy a condition and as an encoding of the input/output relationship of a function.
[…] Where the complex points are: the graph of a function […]
[…] Where the complex points are: the graph of a function […]
[…] Where the complex points are: the graph of a function […]