A lot of people introduce the derivative at a point as the slope of the tangent at that point, which to me is quite confusing. It seems to me that the reason we want the derivative is that it is a measure of the slope of our actual function at that point, not the slope of a completely different thing. To me, the thing is that the function itself is pretty much straight if we are close enough to it, so when we’re looking really close, saying it has a slope at this point is a meaningful thing to say.
For years I got at this idea by drawing a little magnifying glass on my function, and a big version nearby to show what you could see through the magnifying glass. But last year I decided to get technology to help me do this dynamically and I made a Desmos graph with a zooming view window that will show you the view on a tiny circle around a point on a curve. (Some of the bells and whistles here were provided with a little help from Andrew Knauft.)
Here’s what the graph looks like, and a link to the graph so you can play with it yourself: https://www.desmos.com/calculator/pa1cudpc07
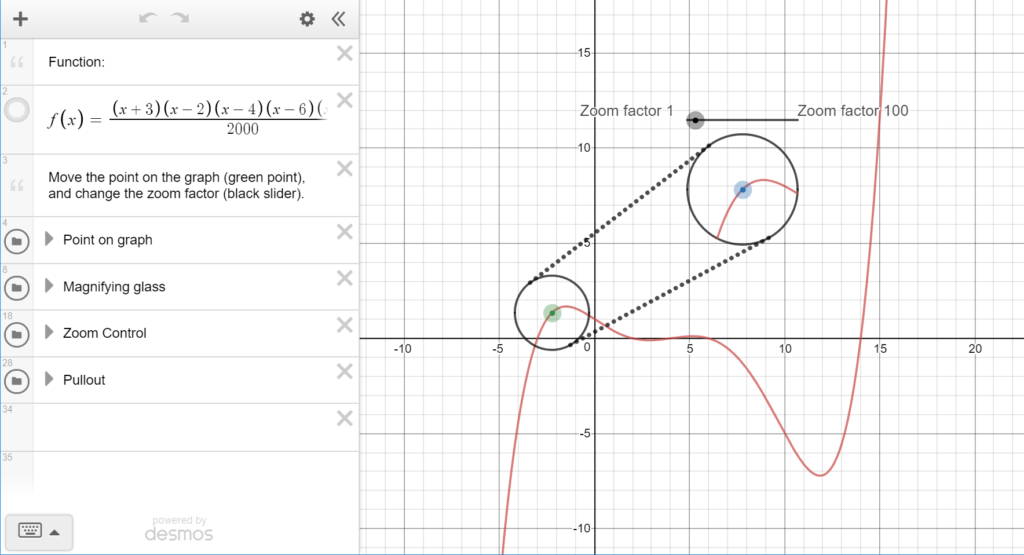
I’ve used this to help students see that the curve itself really does look straight when you’re very close, and so treating it like it is straight there and saying it has a slope is a reasonable thing to do. Students are usually most impressed and love to play with it. It’s also interesting to put in a function with a kink in it like |x2-1| to show that the kink never goes away no matter how closely you view the function, so having a single slope there isn’t really reasonable.
Every time I’ve had to search my own twitter account to find the tweet where I shared it, and I couldn’t keep doing that, so here it is in a quick blog post for posterity.