
In a recent post we observed that data on average weekly earnings showed that wages growth in the South Australian public sector had been outstripping wages growth in the private sector over recent years. However, we noted that caution should be exercised when using data on average weekly earnings to monitor differences in wages growth over time. Average weekly earnings (AWE) are sensitive to compositional shifts in employment (e.g. between full-time and part-time employment, entry level and senior positions etc.), while the ‘weekly total earnings’ measure of AWE is sensitive to changes in overtime earnings.
If the goal is to measure differences in wage price inflation, a better measure is the Wage Price Index (WPI), which is specifically designed by the ABS to measure how the “price” of wages and salaries changes over time. The WPI effectively holds the “quantity” and “quality” of labour constant over time, measuring changes in wages and salaries paid by employers for a unit of labour. (Further detail regarding differences between the WPI and AWE are provided by the ABS in this article.)
The figure below shows annual percentage changes in the ‘all industries’ public and private sector WPIs for South Australia over recent calendar years. The WPI for the public sector in South Australia did indeed grow faster than for the private sector over the last three years, after growing more slowly relative to the private sector between 2011 and 2013. Over the 4 years to 2017 the public sector WPI expanded at an average rate of 2.5 per cent per annum whereas the private sector WPI grew at 2.3 per cent per annum.
The latest quarterly data indicates that growth in public sector hourly wages in South Australia has now slowed relative to the private sector. The public sector index for South Australia rose by 1.8 per cent through the year to the December quarter 2017, whereas the private sector index grew by 2.1 per cent over this period.
Figure 1: Annual percentage change in wage price index for private and public sectors(a)
South Australia, total hourly rates of pay excluding bonuses
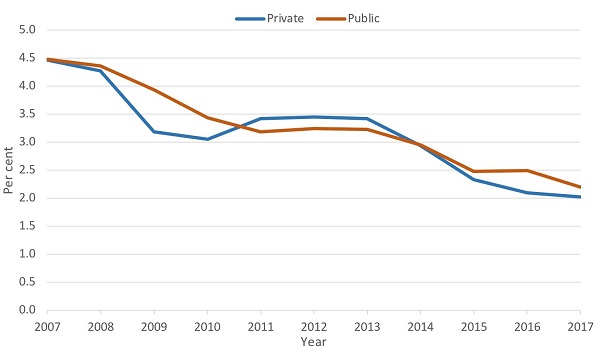
Note: (a) Wage price index is for total hourly rates of pay excluding bonuses.
Source: ABS, Wage Price Index, Australia, December 2017. Cat. No. 6345.0.
Relatively stronger public sector wages growth over recent years is not a South Australian only phenomenon, as Table 1 shows. The public-private wages growth differential over the last 4 years was even larger at the national level with the Australian public sector WPI rising by 2.5 per cent per annum over this period compared to 2.1 per cent for the private sector. Interestingly, over the last 4 years the price of private sector wages and salaries as indicated by the WPI has grown marginally more strongly for South Australia than Australia (2.3 per cent versus 2.1 per cent), while public sector wages and salaries has grown at the same pace for South Australia and Australia (2.5 per cent).
Looking at comparisons across individual states and territories, South Australia actually had one of the lowest public-private sector wage growth differentials over the 4 years to the 2017 calendar year. Only Tasmania and the Australian Capital Territory recorded relatively stronger growth in private sector wages compared to the public sector over this period.
Table 1: Average annual percentage change in wage price index for private and public sectors(a)
Four years to 2017 calendar year, total hourly rates of pay excluding bonuses
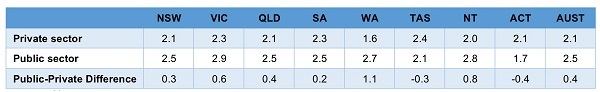
Source: ABS, Wage Price Index, Australia, December 2017. Cat. No. 6345.0.
In fact, the public-private sector wage growth differential is a long-term phenomenon. Over the 19 years to 2017 the WPI for the private sector in South Australia grew by 3.2 per cent per annum on average whereas for the public sector it grew by 3.5 per cent. The corresponding national figures are the same, with a high degree of similarity across states and territories, especially for private sector wages.
Perhaps the real interesting question to emerge from the comparison considered here is why has SA private sector wages held up so strongly against national trends despite much greater unemployment and underemployment? Normal demand-supply responses would suggest that wages would grow more slowly given excess labour supply in South Australia. This is ultimately a topic for further research, but some possible causes may include:
- Stickiness in wages between states because some awards are determined nationally.
- Interstate migration tends to equalise growth in wage rates.
- Public sector infrastructure projects propping up private sector wages in construction and other sectors with strong links to infrastructure activity.
- Mismatch between demand and supply in terms of skills (e.g. loss of manufacturing jobs when aged carers in demand).
- National private sector wages growth held back by weak growth in WA and to a lesser degree QLD due to lag effects from the end of the mining boom.